Chart GPT AITéléchargez un graphique boursier et obtenez une analyse technique alimentée par l'IA en quelques secondes.

Aperçu
Fonctionnalités clés
- Téléchargement et analyse de graphiques basés sur l'image
- Reconnaissance de motifs et de tendances
- Identification des niveaux de support et de résistance
- Interprétation des chandeliers et des indicateurs
- Perspectives de trading en langage clair
- Support multi-marché
Tarifs
- Modèle
- Freemium
- Catégorie
- Finance
- Note
- 4.6 / 5 (5)
Cas d’usage
Deuxième avis rapide sur un graphique boursier
Les traders particuliers téléchargent une capture d'écran d'un graphique pour obtenir une décomposition générée par l'IA de la tendance, du support et de la résistance avant de décider d'entrer ou de sortir d'une position.
Reconnaissance de motifs sur graphique crypto
Les traders crypto téléchargent des graphiques pour identifier les motifs de chandeliers et les signaux de tendance potentiels sur des marchés volatils sans appliquer manuellement plusieurs indicateurs.
Apprentissage des bases de l'analyse technique
Les débutants téléchargent des graphiques et lisent des interprétations en langage clair de l'action des prix, les aidant à comprendre comment les motifs, les niveaux clés et les tendances sont lus.
Planification de scénarios de graphique Forex
Les traders Forex utilisent des résumés IA de la direction de la tendance et des niveaux clés pour esquisser les scénarios haussiers ou baissiers possibles à surveiller pendant une session de trading.
Pour & contre
Pour
- Analyse rapide à partir d'un simple téléchargement de graphique
- Aucune expertise en analyse technique requise pour l'utiliser
- Fonctionne sur les actions, la crypto et d'autres marchés
- Fournit des analyses structurées et faciles à lire
Contre
- La qualité de l'analyse dépend de la clarté du graphique
- N'est pas un substitut à un conseil financier professionnel
- L'IA peut mal interpréter des graphiques complexes ou peu clairs
Avis
Moyenne sur 5 avis.
Connecte-toi pour laisser un avis.
Compared a few options
Evaluated this against two competitors. Where it wins: support and resistance identification and no technical analysis expertise required to use. Where it lags: analysis quality depends on chart clarity. On balance the feature set — especially image-based chart upload and analysis — justifies the 4 stars for our use case.
Use it every day
Honestly didn't expect to like it this much. Candlestick and indicator interpretation is exactly what I needed, and provides structured, easy-to-read breakdowns. I do wish analysis quality depends on chart clarity, but I reach for it almost every day now and it just clicks.
Compared a few options
Evaluated this against two competitors. Where it wins: multi-market support and provides structured, easy-to-read breakdowns. On balance the feature set — especially multi-market support — justifies the 5 stars for our use case.
Solid for our team
We rolled this out across the team last quarter and provides structured, easy-to-read breakdowns. Pattern and trend recognition fits neatly into how we already work, and multi-market support removed a step we used to do by hand. Not a substitute for professional financial advice, which is the main caveat, but it has held up under daily use.
Years in this space
I've evaluated a lot of these over the years. What stands out here is image-based chart upload and analysis — handled better than most — and no technical analysis expertise required to use. Analysis quality depends on chart clarity is my one real gripe. Worth the time if this is your use case.
Questions & réponses
Pas encore de question — sois le premier à demander.
Poser une question
Alternatives à Finance
AICell
Finance
Un réseau d'agents d'IA décentralisé intégrant l'IA avec Web3 pour instaurer un système sans permission de services financiers propulsés par l'IA.

Oraczen's Zen Platform
Finance
Plateforme d'entreprise pour créer et déployer des agents IA sur mesure, alimentés par les connaissances d'entreprise.
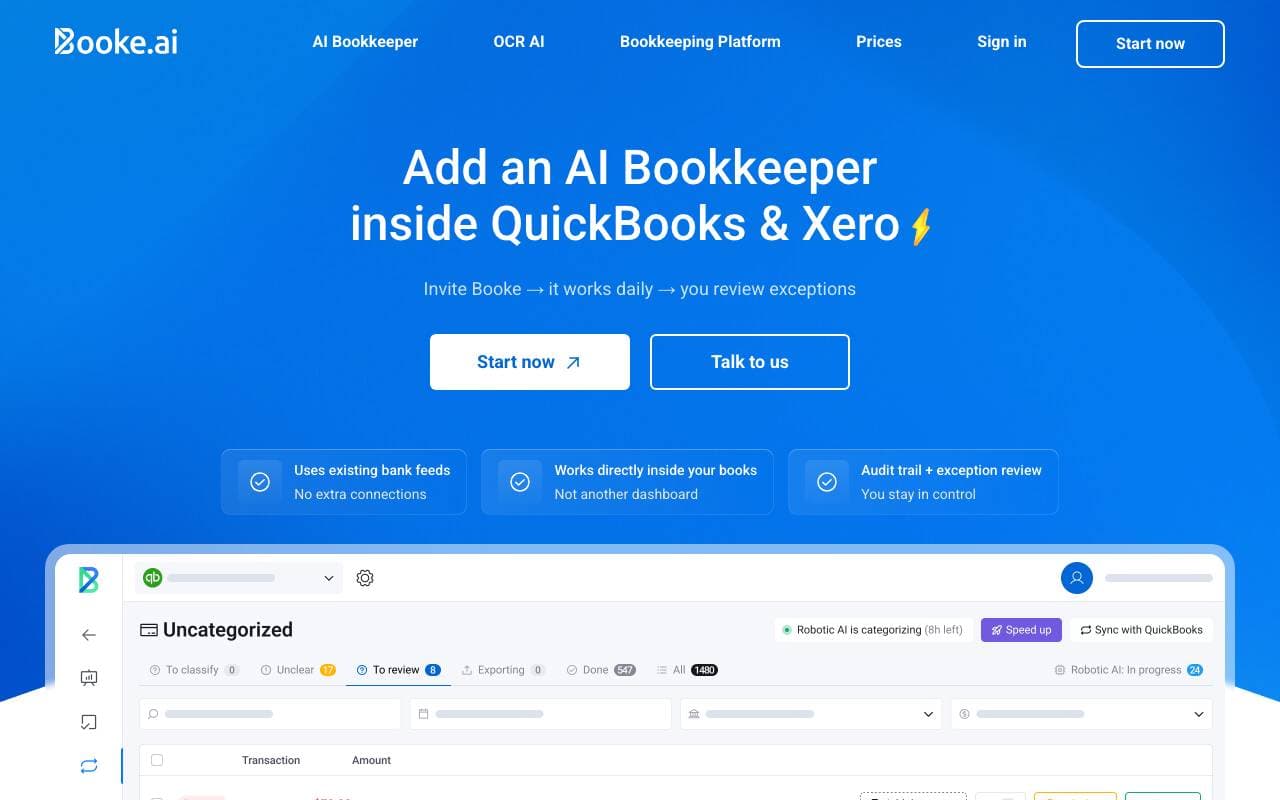
Booke AI
Finance
Comptable IA autonome qui catégorise et rapproche les transactions dans QuickBooks et Xero.
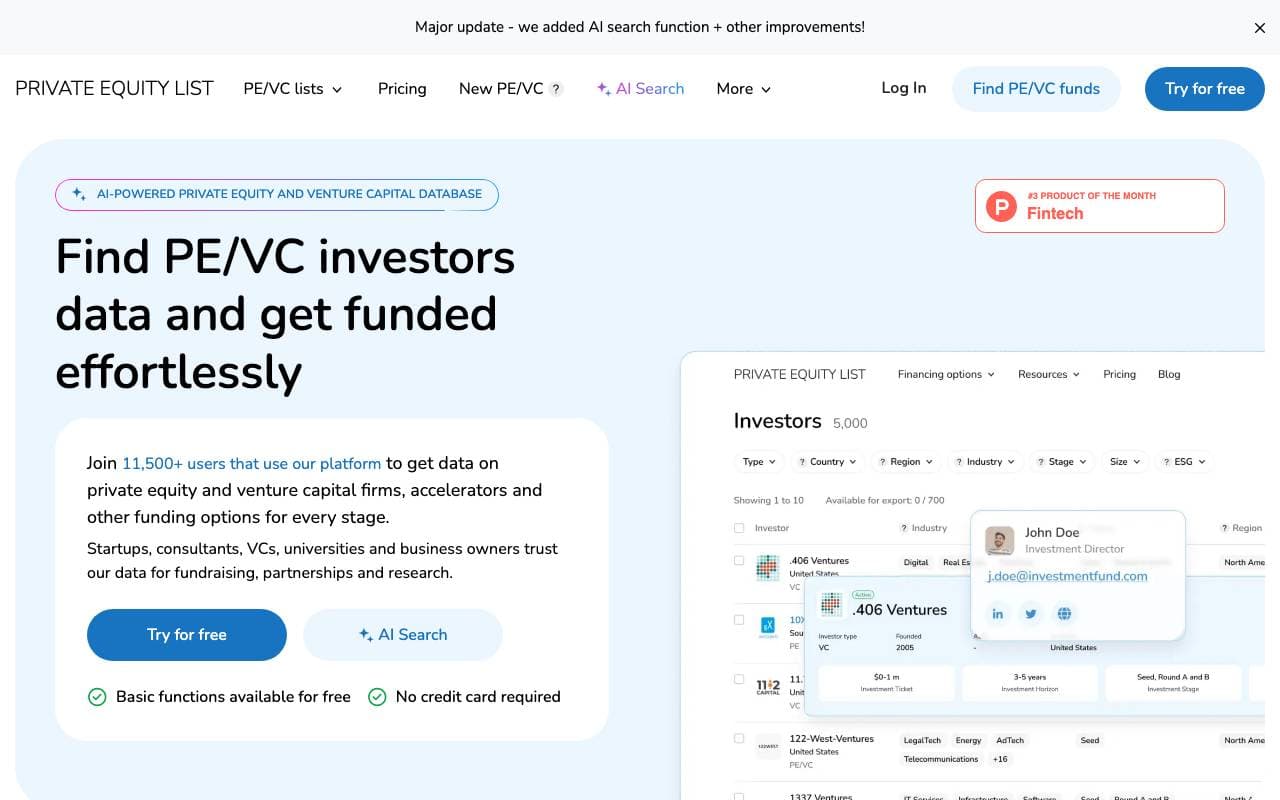
Private Equity List
Finance
Base de données alimentée par l'IA pour la recherche et le tri de sociétés de capitaux privés et de capital-risque.
Lendtrain
Finance
Vérifications de taux de refinancement hypothécaire et analyse de économies personnalisée basées sur l'IA.
DipTrack
Finance
Tracker simple pour suivre les creux en temps réel pour les actifs et les cryptomonnaies

AI signals
Finance
Signaux de trading alimentés par l'IA délivrant des alertes d'achat et de vente en temps réel à travers les marchés mondiaux.
MarketMind
Finance
Plateforme d'intelligence de marché alimentée par l'IA pour des décisions commerciales plus rapides et basées sur les données.
Trending now

Claude
AI Agents & Chatbots
Assistant IA conversationnel d'Anthropic pour la rédaction, l'analyse, la programmation et les tâches documentaires
Doozer Ai
Sales Agent
Les co-travailleurs numériques qui automatisent les workflows opérationnels pour augmenter l'efficacité de l'équipe.
Pin AI
Workflow automation
Récupérateur AI autonome qui automatise le sourcing, l'analyse et l'approche pour accélérer l'embauche.
Local GPT
Other
Intelligence artificielle locale open-source pour un chat privé et hors ligne sur des documents utilisant des modèles de type GPT sur votre propre matériel.